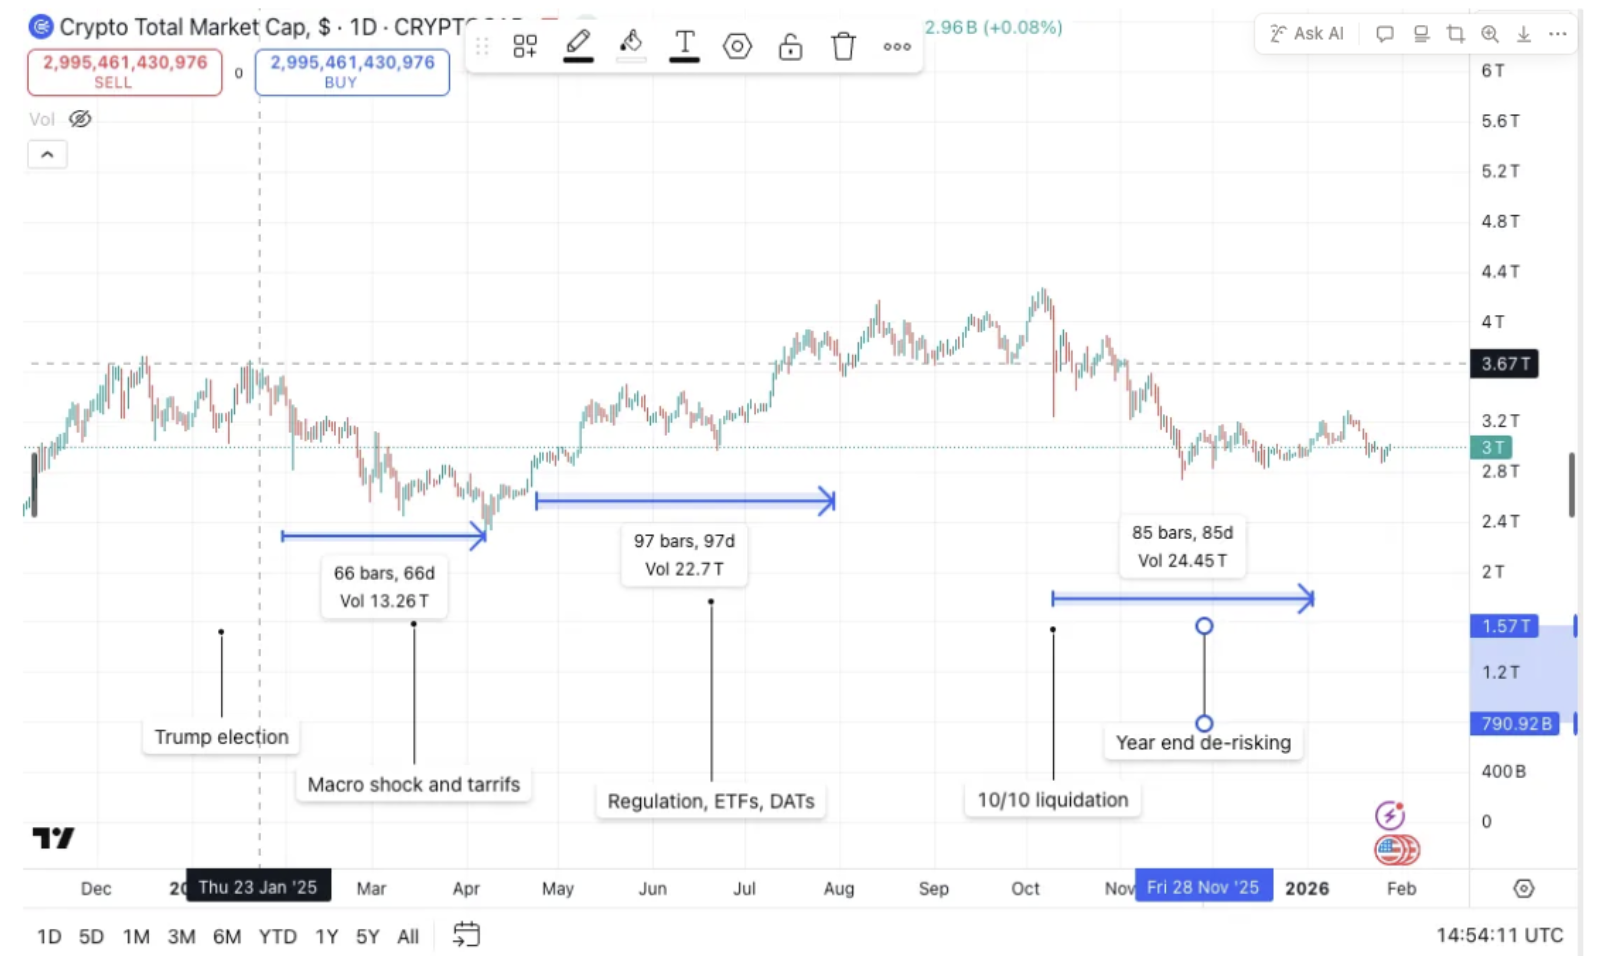
During 2025, the overall crypto market cap declined by approximately -9%, going from $3.2tn to $2.9tn. No one was expecting such a volatile environment, where market reached an all-time high of $4.3tn in October before retracing to negative performance towards year end.
The year unfolded in phases. Q1 was characterized by the early effects of the Trump administration, macro shocks, and tariff uncertainty. Q2 and Q3 were defined by positive regulatory change in the U.S., sustained ETF inflows, sizeable capital deployment into Digital Asset Treasury companies (DATs), and a shift in interest rate policy. Q4 was defined by the largest liquidation event in crypto history, which triggered a regime change in market structure and correlation behavior (more detail below).
Total Crypto Market Cap for 2025:
The Regime Changes on 10th of October
Through the summer, retail and institutional capital alike positioned aggressively long through DATs, ETFs, spot holdings, and leveraged products. By early October, open interest across major derivatives venues reached an all-time high of $222bn, with funding rates climbing from approximately 10% annualized to nearly 40% by November. A significant share of that exposure sat on venues using unified (cross asset) margin, a design that is capital efficient in calm markets but ties portfolios to their weakest positions under stress.
History of Liquidations across CEX and DEX Venues:
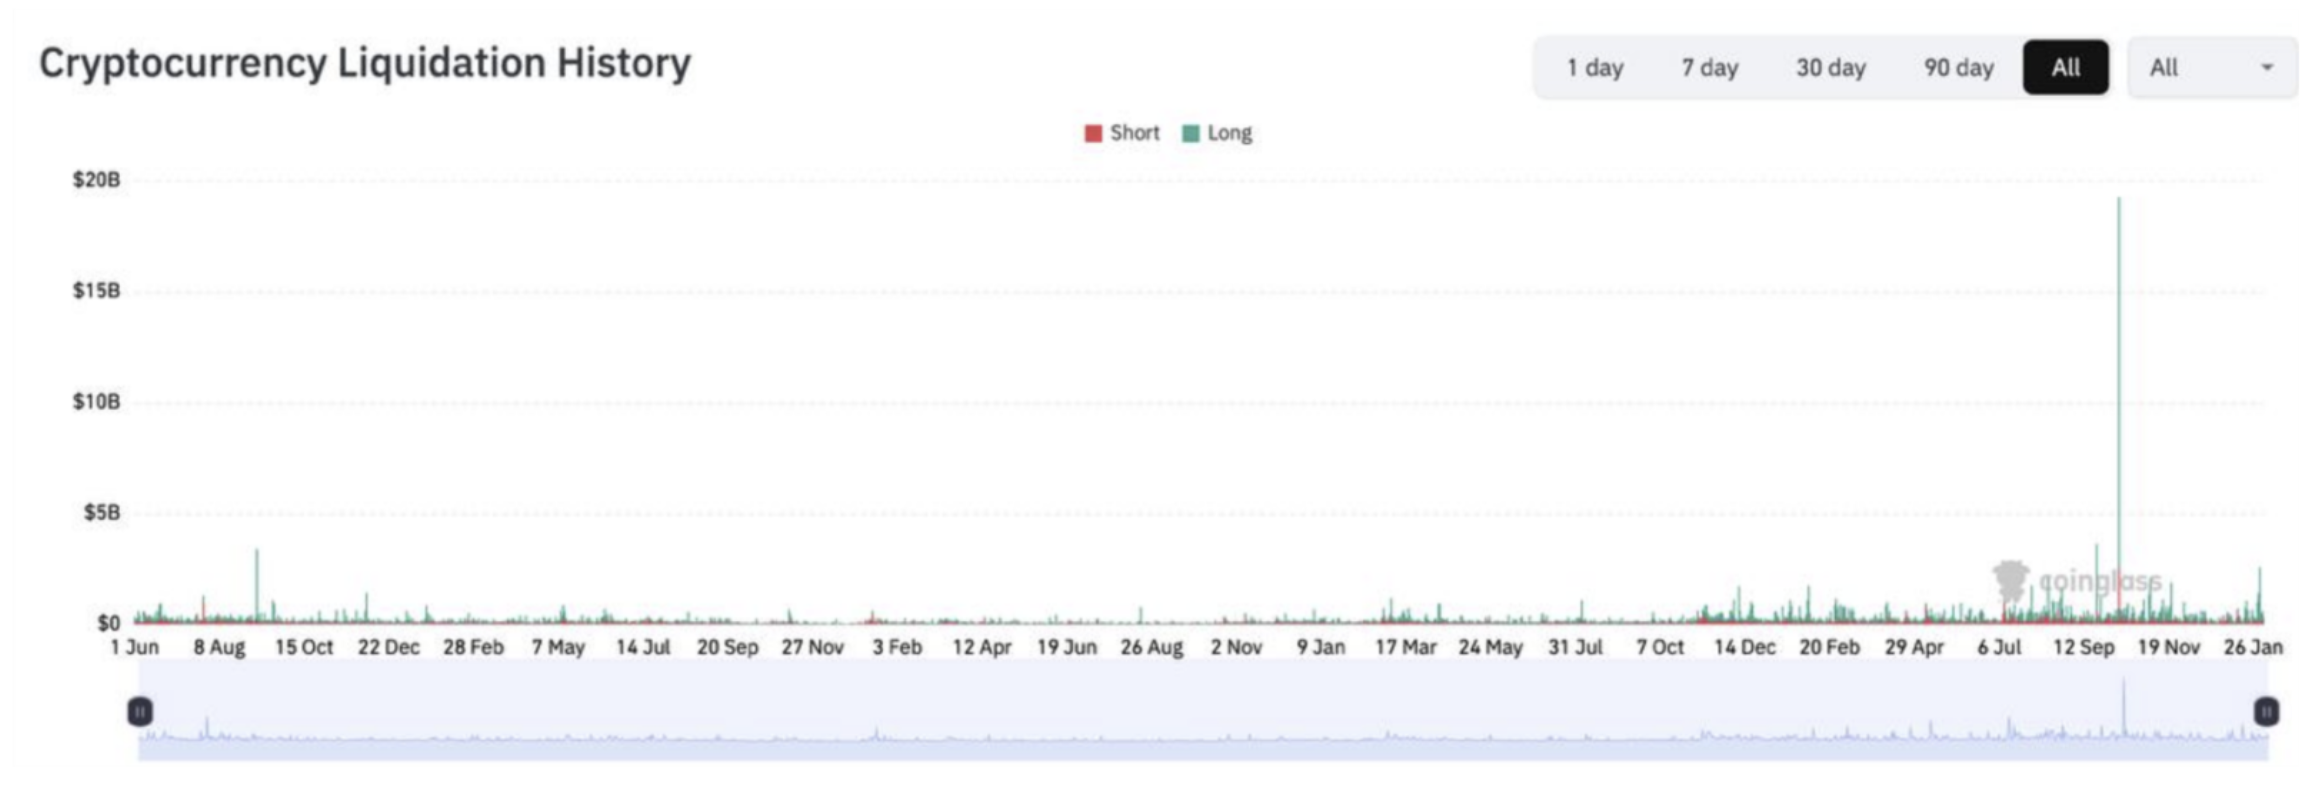
October 10 was the key day that changed the course of the year. President Trump announced a 100% tariff on all Chinese imports which caused a selloff in risk assets. It hit the market that was already heavily levered. The unwind became self-reinforcing as liquidity thinned and forced selling accelerated.
More than $19bn of leveraged positions were liquidated in roughly 24 hours, making it the largest single day deleveraging event in crypto history, approximately nine times larger than typical liquidation episodes. Total perpetual futures open interest contracted 31%, falling from $220bn to $150bn. Bitcoin fell 14% from ~$122,500 to ~$105,000, Ethereum dropped 19%, and Solana briefly lost over 20% of its value before partially recovering.
What matters for understanding is not just the scale but the mechanism: leverage concentration, unified margin design, and liquidity evaporation combined into a margin spiral. Order book depth on major assets shrank on key venues as market makers withdrew (or exchange APIs stopped working), turning what began as a macro driven sell off into a structural stress test.
Continued Decline into 2026
The October crash did not resolve into a V shaped recovery. Instead, it marked the beginning of a sustained drawdown. Four-year cycle muscle memory led to significant selling from long term Bitcoin holders, creating persistent downward pressure. ETF flows, which had averaged approximately $3-6bn per month through the first April of 2025, reversed sharply, with over $6bn in net outflows from October through December. By early February 2026, BTC briefly broke below $61,000, its lowest level since October 2024, and trades around $69,000 at the time of writing, down approximately 21% year to date.
Decoupling
Following 10/10, correlation behavior changed. Periods that historically would have seen crypto move tightly with U.S. tech equities instead showed looser, and at times inverse, moves as leverage and liquidity conditions inside crypto dominated day to day pricing. In stress regimes, crypto can trade less like a macro proxy and more like its own microstructure system, where the marginal forced seller matters more than the marginal macro buyer.
BTC Price and Nasdaq during 2025:

Deceleration of the DATs Accumulation
Digital Asset Treasury companies were one of the defining narratives of 2025, with aggregate assets under management eclipsing $100bn by the end of Q3, up 50% from Q2. DATs served as a powerful capital formation mechanism, allowing public equity investors to gain indirect exposure to digital assets through listed vehicles. Through sustained equity issuance at premiums to net asset value, DATs became a meaningful source of marginal demand for assets like BTC and SOL.
Percentage of Digital Assets Held by DATs:
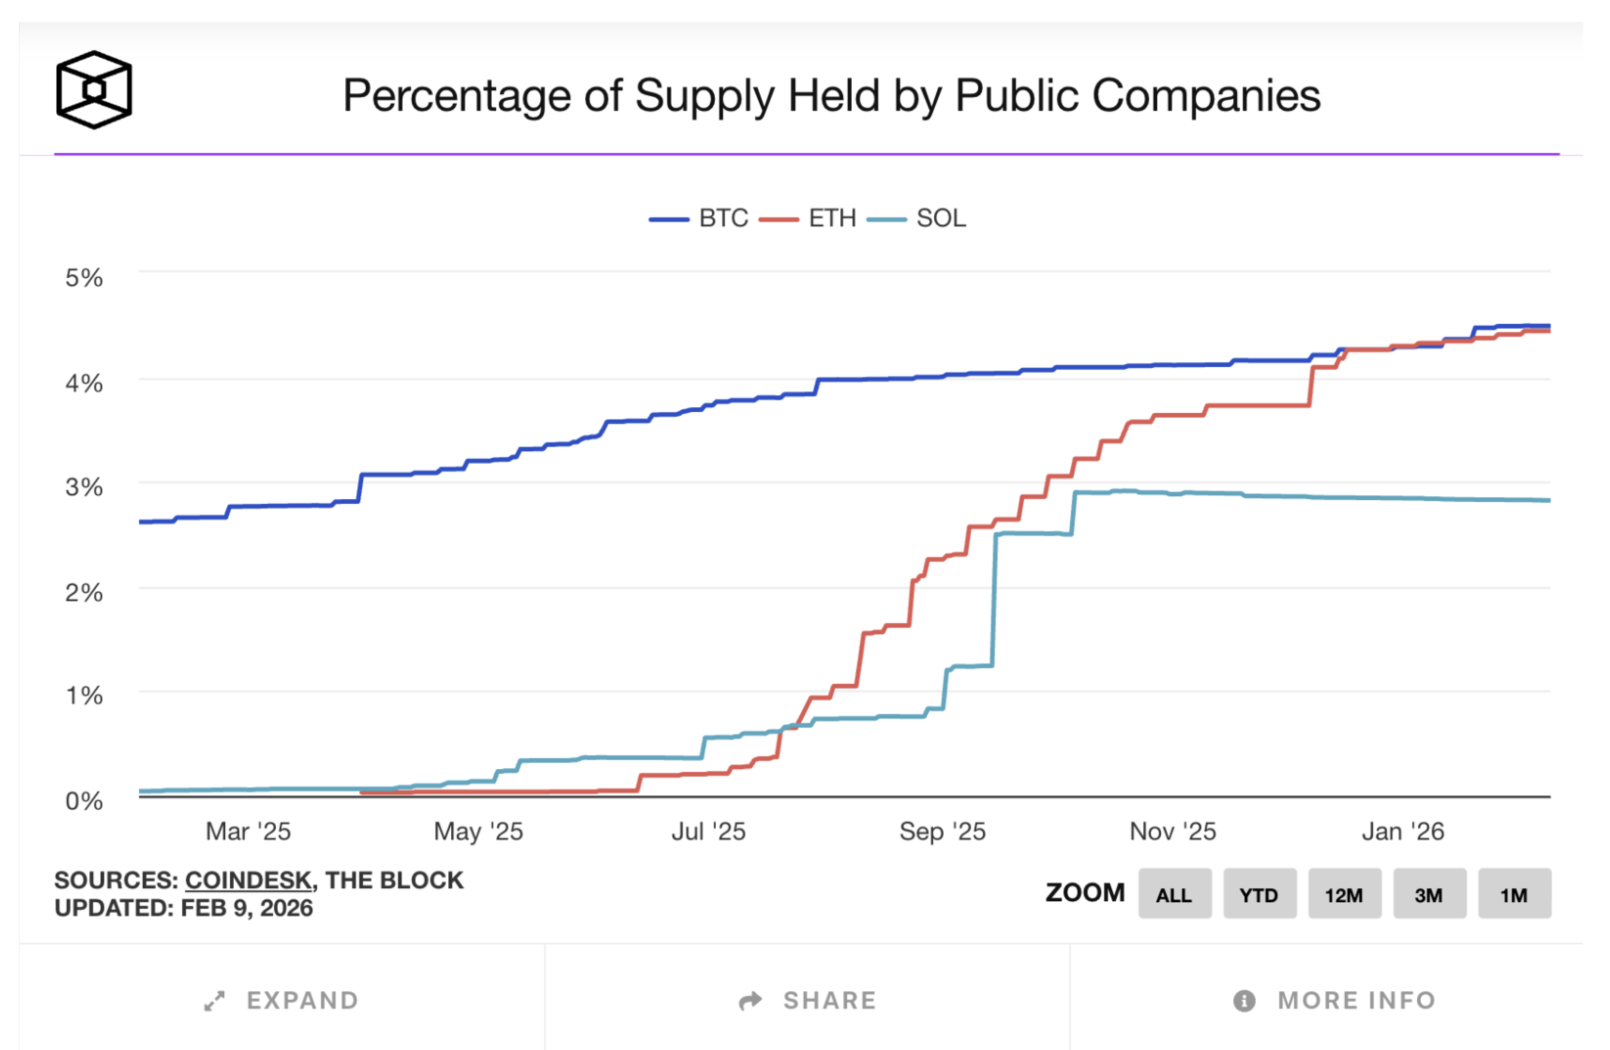
However, as the broader market sold off post October, many vehicles saw their mNAV multiples compress below 1.0x, effectively shutting down their primary capital raising tool. With premiums gone, the economic logic of equity funded accumulation breaks down, and several DATs pivoted or paused buying altogether. This removed a structural price floor that had supported accumulation throughout the summer, creating a market where new supply from OG holder selling met declining demand from institutional vehicles, compounding the downward pressure.
Fundamentals Continue to Improve
While price action has been challenging, the underlying fundamentals of the digital asset ecosystem have continued to strengthen across several key dimensions.
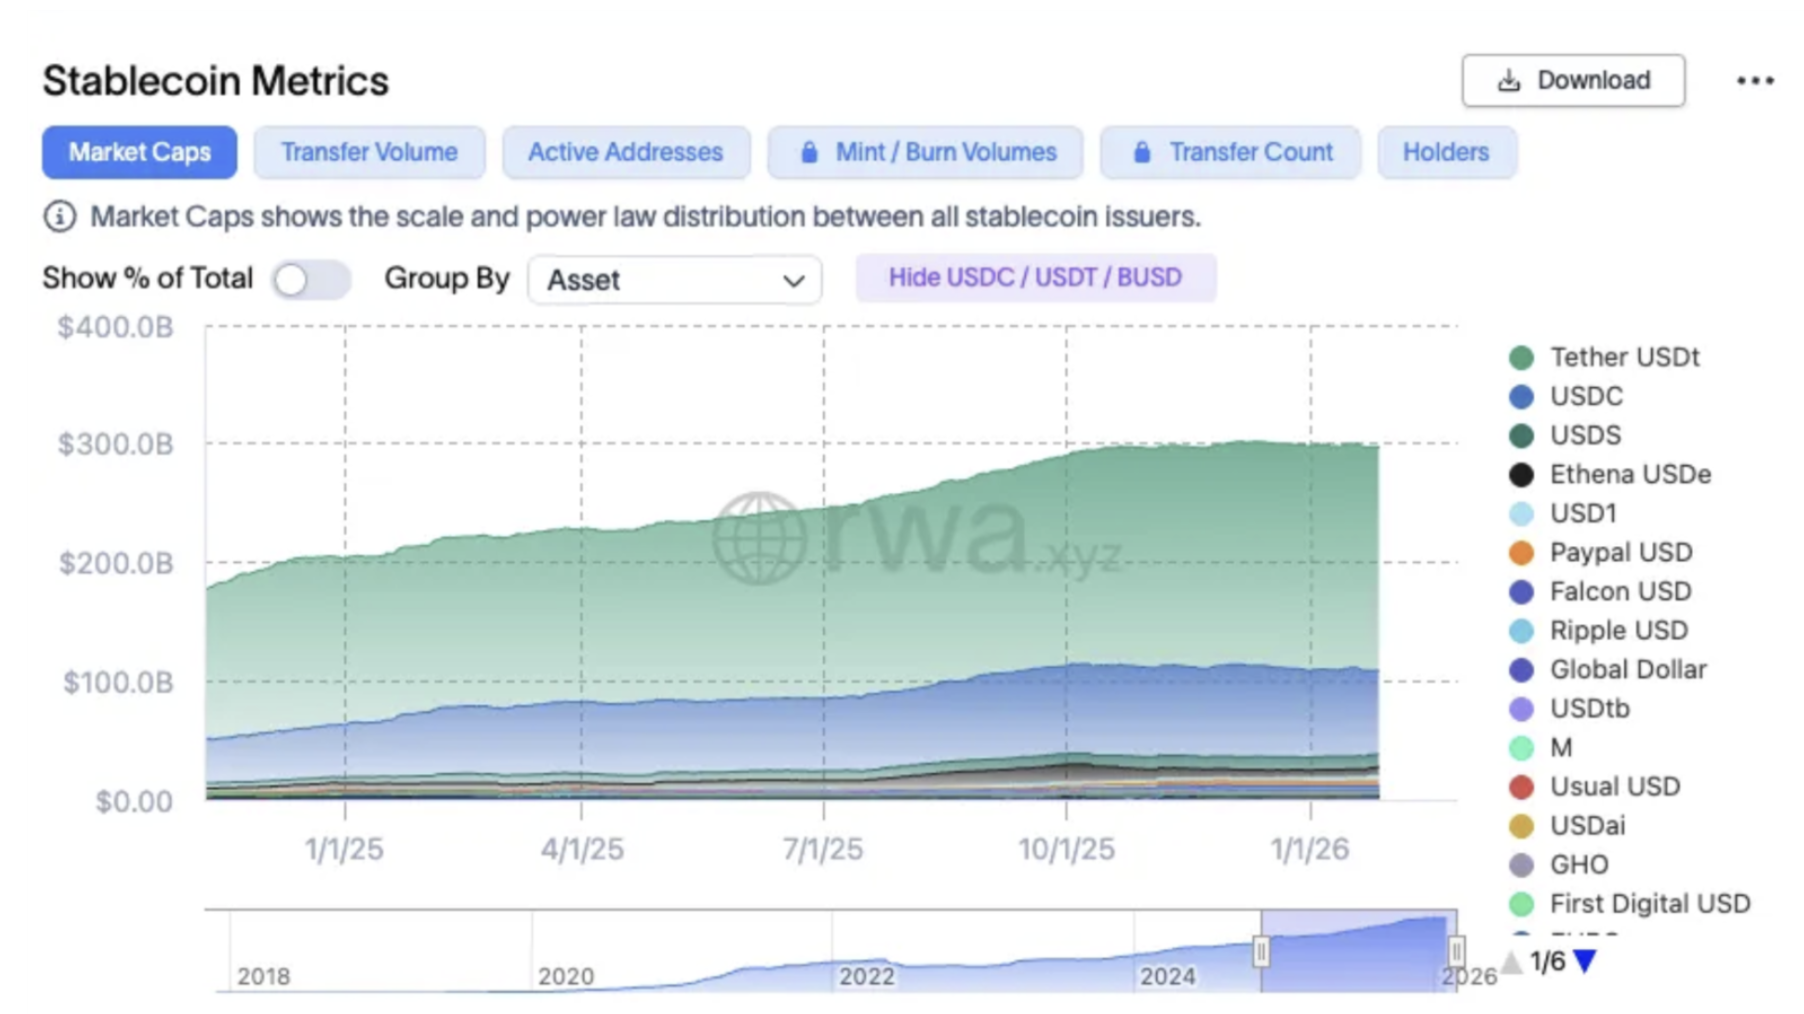
Stablecoins at all-time highs. Outstanding stablecoin supply surpassed $300bn in 2025, with monthly transfer volumes averaging $6.9tn over in December (note that VISA does $1.2tn monthly payment volumes). Stablecoins are increasingly being used not just for trading but as programmable balance sheet instruments for treasury management, cross border settlement, and payments. The passage of the GENIUS Act in July provided a comprehensive regulatory framework, accelerating institutional adoption. Circle's IPO in June further validated the category.
Stablecoins in Issuance:
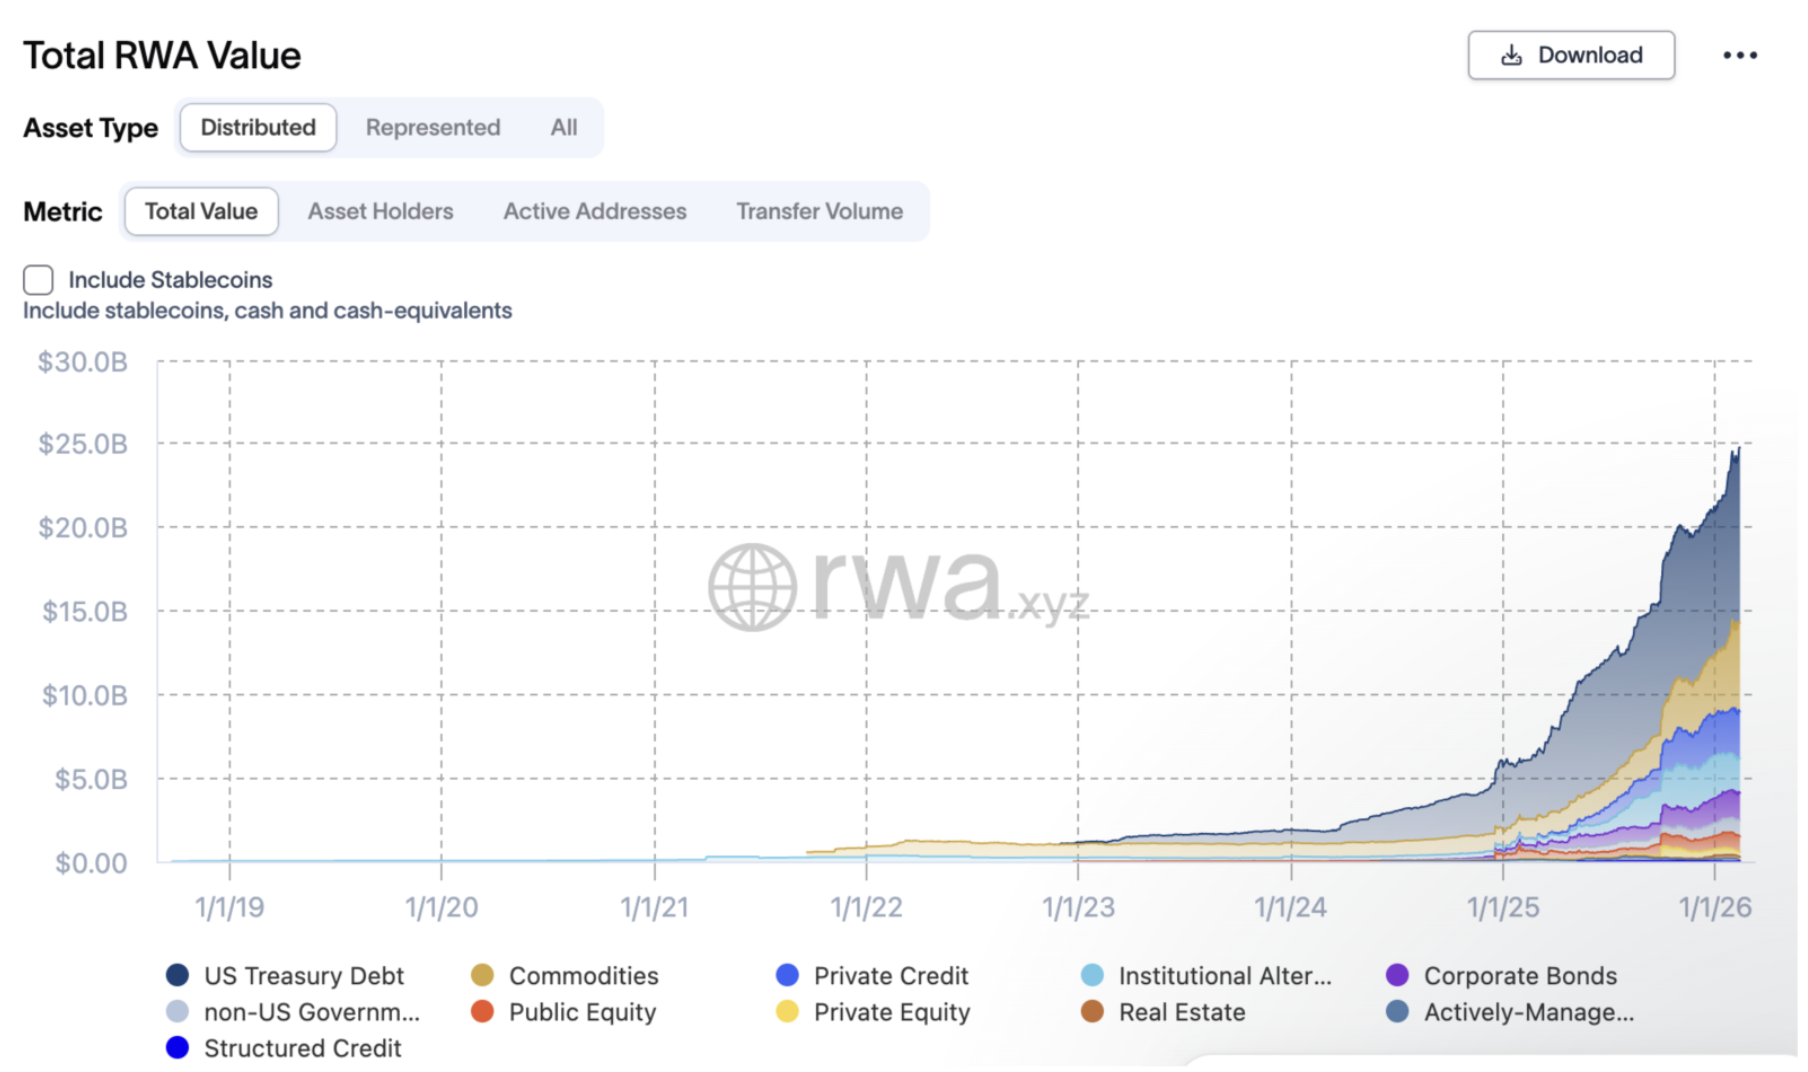
Real world asset tokenization reaching scale. On chain RWA (“real world assets”) value expanded from approximately $5bn at the start of 2025 to over $18bn by year end, with some estimates reaching $25bn depending on methodology. Tokenized U.S. Treasuries, credit products, and funds moved from pilot programs into active deployment, with BlackRock's BUIDL fund (tokenized US treasuries) exceeding $1.7bn. RWAs are no longer experimental; they are integrating directly into lending, collateral, and liquidity systems as active components of on chain balance sheets.
RWA Issued:
These fundamental improvements represent the structural shift we have been investing behind digital assets moving from speculative instruments to functional financial infrastructure.
Going Forward
Despite the challenging price environment, we view the current period as a transition rather than a structural breakdown. The leverage excesses that drove the October crash have been substantially purged, the regulatory backdrop remains the most favorable it has ever been for digital assets in the U.S., and the structural trends in stablecoins, RWA tokenization, and institutional on chain infrastructure continue to accelerate even as token prices lag.
We remain focused on projects with real revenue, defensible market positions, and strong alignment between equity and token value. We continue to actively support our portfolio companies through this cycle and will use periods of dislocation to strengthen positions where conviction warrants.
